

Sustainability
Blog
Product Carbon Footprint for Pakistani Textile Mills
How a product carbon footprint is built for Pakistani textiles: the life cycle stages, the activity data a mill must record and the data quality buyers test.

A European buyer asks for a garment's carbon footprint. The Pakistani supplier has no number to send back. The request is reasonable, and it can be answered, but only from records kept while the goods were made. A product carbon footprint is a modelled estimate built from activity data and stated assumptions. It is not a measurement taken from the product.
Primary data from meters and purchase ledgers decides whether that estimate survives buyer review.
A footprint is counted per unit of product, and an inventory per site and year
ISO 14067 sets the requirements for quantifying and reporting the carbon footprint of a product. The result covers the greenhouse gases released across a defined life cycle, expressed as carbon dioxide equivalent per functional unit, such as one kilogram of fabric or one finished garment.
An organisation inventory answers a different question. It reports the emissions of a site or a company for a year, in tonnes of carbon dioxide equivalent, usually split into Scope 1, Scope 2 and Scope 3 under ISO 14064-1 or the GHG Protocol Corporate Standard. That total lets a mill track its own performance. It gives a buyer no figure per garment, and it can't be divided down without a model.
Because a footprint is built from activity data and emission factors, it carries uncertainty. It also depends on choices made inside the model, so the assumptions have to travel with the number.
ISO 14067 applies the life cycle method of ISO 14040 and ISO 14044 to a product
The method underneath is life cycle assessment. ISO 14040 sets the principles and framework for a study, and ISO 14044 sets the requirements and guidelines. ISO 14067 applies that method to a product carbon footprint and adds rules on system boundary, data and reporting.
The other common reference is the GHG Protocol Product Standard, formally the Product Life Cycle Accounting and Reporting Standard. Its published scope covers raw materials, manufacturing, transport, storage, use and disposal. The same page notes that comparing one product with another needs category rules. No general standard can fix every assumption.
In February 2026 GHG Protocol and ISO announced a joint working group to update and harmonise the product level standard. Until that work is finished, a reported figure is only as comparable as the method stated beside it.
A mill holds data for the middle of the life cycle and depends on others for the ends
For a garment or fabric, the stages run from fibre to disposal: fibre production, spinning, knitting or weaving, dyeing and finishing, cut-make-trim, transport, use, and end of life. A Pakistani export mill usually holds detailed data for the middle of that chain.
Life cycle stage | Data the supplier usually controls | Where the rest sits |
|---|---|---|
Fibre production | Fibre type and mass purchased, supplier declarations | Farm inputs, fertiliser and irrigation use; grower or trader |
Spinning | Yarn mass and energy, where the spinner is owned | Cotton origin and gin records; upstream spinner |
Knitting or weaving | Machine hours, electricity, greige fabric mass | Yarn supply records; spinner |
Dyeing and finishing | Fuel, electricity, water and chemical purchase records | Chemical formulation detail; chemical supplier |
Cut-make-trim | Garment count, rework, factory electricity | Marker efficiency; brand or design owner |
Transport | Inbound and outbound distance, mode, consignment mass | Carrier and forwarder records |
Use | Care label content only | Consumer behaviour and wash data |
End of life | Nothing directly | Waste collection and recycling route |
For a cotton garment, fibre is the stage with the largest uncertainties, and nitrogen fertiliser and irrigation energy dominate it. Published estimates for Pakistani conventional cotton fibre sit near 4 to 7 kilograms of carbon dioxide equivalent per kilogram.
Primary data carries more weight than database averages
A footprint mixes two kinds of input. Primary data is measured at the site, or taken from purchase records, for the process being modelled. Secondary data is a background value borrowed from a published life cycle inventory database.
Primary data carries more weight because it traces to a meter or an invoice. Secondary values are defensible for stages the mill does not control, provided the source and year are named. A footprint built mostly on database averages describes an average plant.
Wet processing is usually the stage a mill can fix fastest. A dye house without recycling uses roughly 100 to 200 litres of water per kilogram of fabric, and a mill with modern reuse holds that near 30 to 60 litres. Metering the process turns a secondary value into a primary one.
A first footprint needs the fuel split and the production volume
Collect activity data for a fixed period, usually twelve months, and keep the evidence behind each figure. Utility meters, fuel notes, chemical ledgers, water readings and freight documents form the base layer.
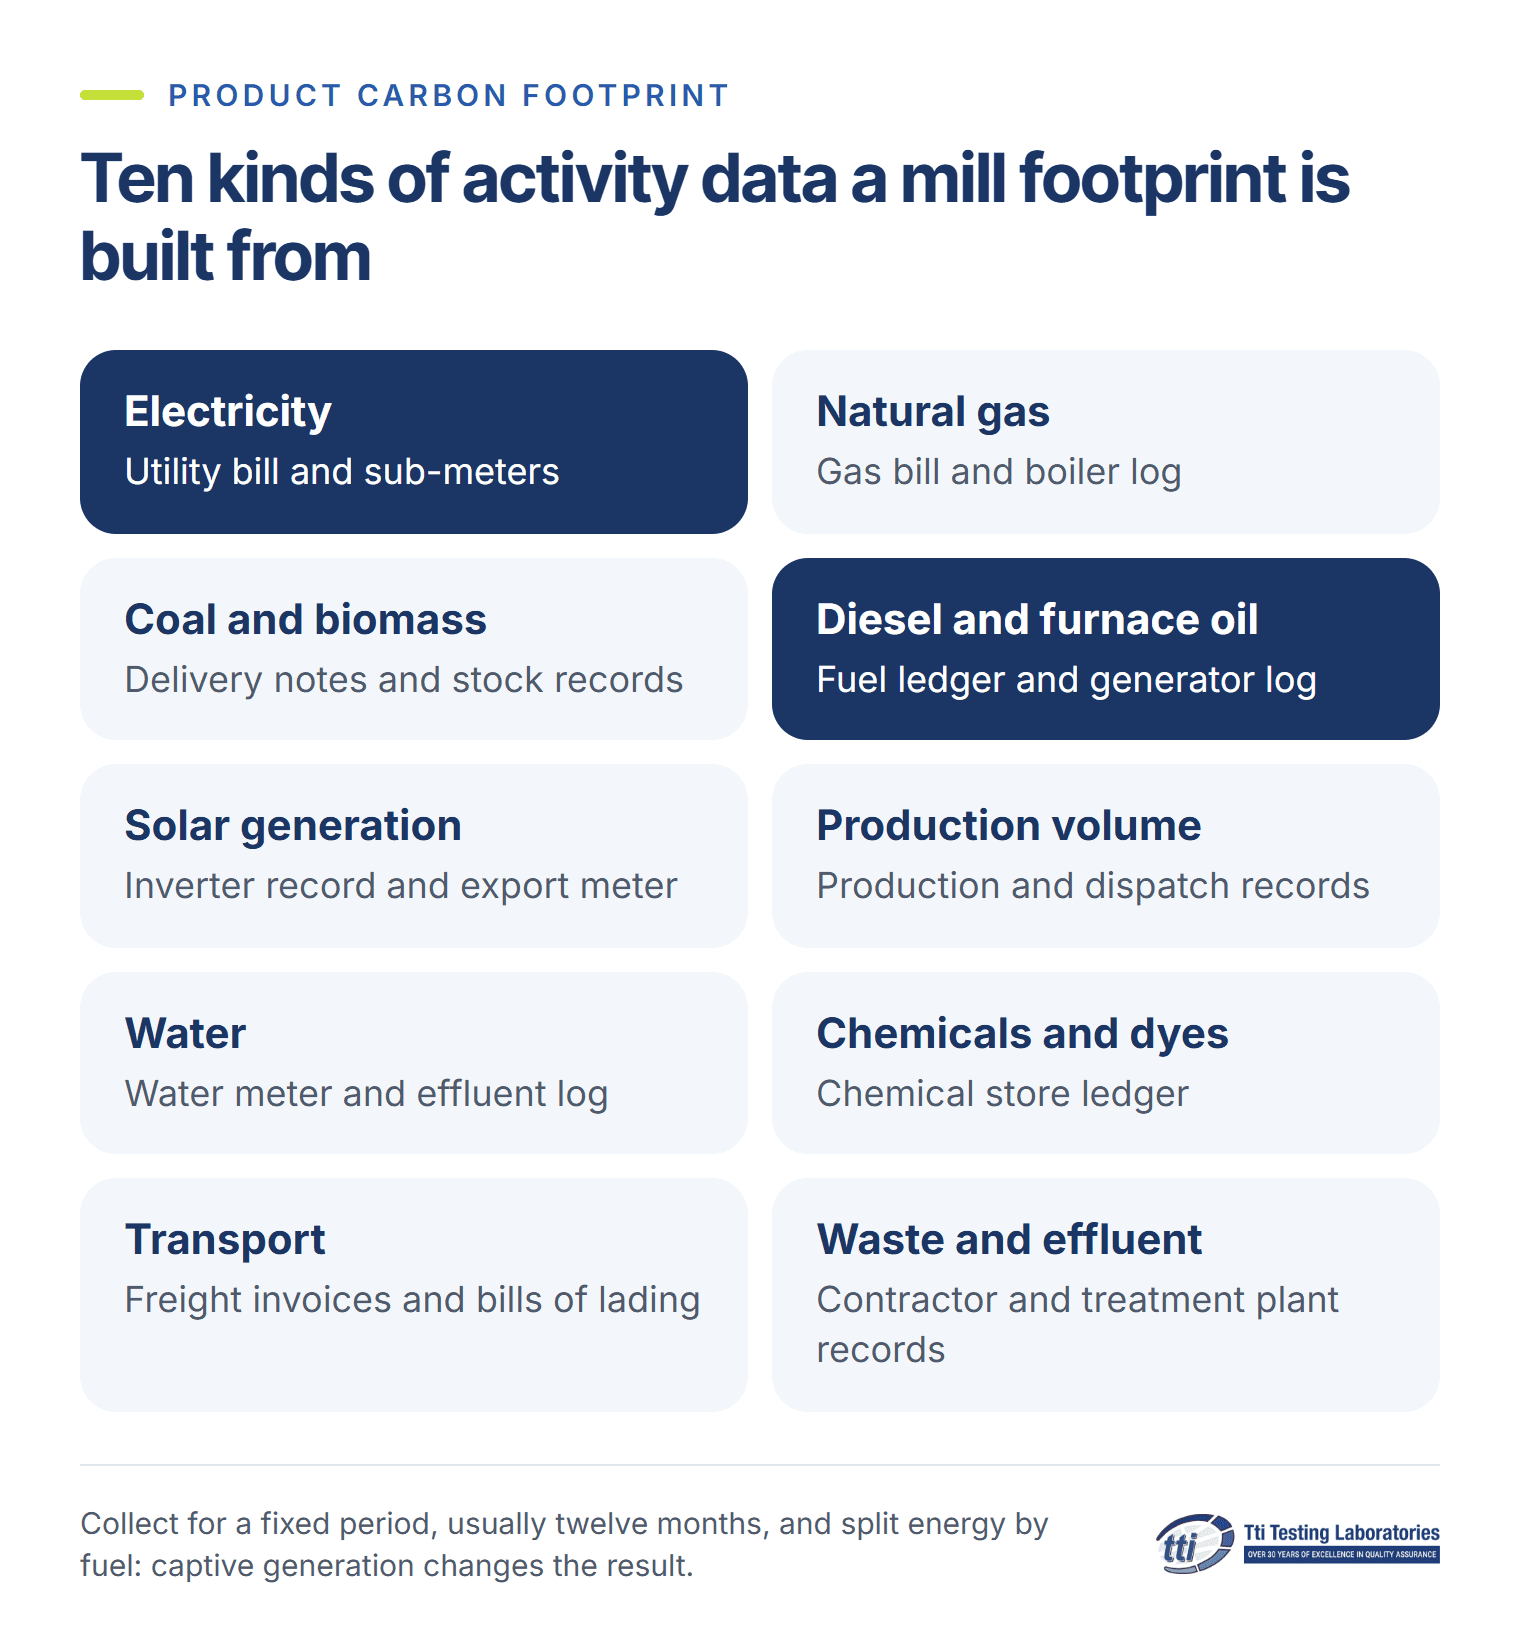
Activity data | What to record | Typical source |
|---|---|---|
Electricity | Metered use by building or line, in kilowatt hours | Utility bill and sub-meters |
Natural gas | Metered or billed volume, in cubic metres | Gas bill and boiler log |
Coal and biomass | Mass purchased and consumed, in tonnes | Delivery notes and stock records |
Diesel and furnace oil | Litres consumed by generators and boilers | Fuel ledger and generator log |
Renewable generation | Solar output and any exported units | Inverter record and export meter |
Production volume | Output by product family, in kilograms or pieces | Production and dispatch records |
Water | Withdrawal and discharge volume, in cubic metres | Water meter and effluent log |
Chemicals and dyes | Mass purchased by product class | Chemical store ledger |
Transport | Distance, mode and consignment mass | Freight invoices and bills of lading |
Waste and effluent | Mass or volume by disposal route | Waste contractor and treatment plant records |
Energy has to be split by fuel. Coal, gas, diesel and grid electricity carry very different emission factors, and the split is sharper in Pakistan, where mills run captive generation during grid interruptions. Production volume is the other figure a footprint can't do without, because it converts a total into an intensity per kilogram or per garment. Water, chemical and transport records then strengthen the result for the buyer's wider reporting.
When one mill makes many products, the allocation basis changes the number
A dye house runs many orders through the same machines. Steam, water, wastewater and compressed air serve the whole plant, so one product's footprint depends on how the shared emissions are divided.
ISO 14044 sets an order of preference for allocation. Common practice is to allocate by a physical measure such as mass; others use a ratio agreed in advance. Two mills with identical operations can report different footprints for the same fabric if one allocates by mass and the other by machine time.
The cleaner route is to avoid allocation. A sub-meter on the line or dyeing vessel that serves the order removes most of the shared cost. Where that is impractical, state the allocation basis in the report and apply it consistently.
A buyer's reviewer will try to rebuild the number from the mill's records
An auditor or an importer's sustainability team will ask for the meter data, emission factors, allocation basis and system boundary. A footprint that can't be reconstructed from those records is only a claim.
The known failure patterns are reports that cover energy but omit water, and comparisons against an unnamed industry average. Selective coverage and unstated assumptions are the weak points.
When a supplier's figure feeds a buyer's own disclosure, its quality travels with it, and a verified inventory carries more weight than a proxy estimate. The difference between the two lies in the documents, and a mill has to start keeping them long before the order.
What Tti Labs supplies for footprint readiness
ISO/IEC 17025 accreditation through the Pakistan National Accreditation Council, published as LAB-022. The scope covers textiles and apparel, leather and footwear, and chemical testing.
A textiles and apparel laboratory that tests fibre composition, chemical content and physical performance.
The Sustainability Center covers the supply chain side. Its published services include greenhouse gas inventory management across Scope 1, Scope 2 and Scope 3, plus emission quantification and carbon accounting.
Multi-tier supplier mapping, due diligence and supplier environmental audits, also in the Sustainability Center's scope.
The Sustainability Center's services supply activity data a footprint is built from. Tti Labs reports results for the samples submitted and the methods performed. It does not certify a product carbon footprint, which remains the claim of the operator that publishes it.
Talk to Tti Labs about footprint data readiness. UAN 111 786 001. ISO/IEC 17025 accredited, PNAC LAB-022.
FAQ
Which standard should a Pakistani mill quote?
ISO 14067, the product carbon footprint standard, with the GHG Protocol Product Standard as the alternative reference. Whichever you quote, always report the number with its method, boundary and period.
Can a supplier produce a footprint without a full life cycle assessment?
Yes, with limits. A screening footprint can combine primary data for the stages the mill controls with secondary values for the rest. The report must name which data is primary and where the boundary stops.
Why do two mills report different footprints for the same fabric?
Usually because of the boundary, the allocation basis or the data source. One may use metered gas and the other a database average. One may allocate shared steam by mass and the other by machine time. The numbers compare only when those choices match.
References
ISO 14067:2018 Greenhouse gases, carbon footprint of products, International Organization for Standardization, https://www.iso.org/standard/71206.html
ISO 14040:2006 Environmental management, life cycle assessment, principles and framework, International Organization for Standardization, https://www.iso.org/standard/37456.html
ISO 14044:2006 Environmental management, life cycle assessment, requirements and guidelines, International Organization for Standardization, https://www.iso.org/standard/38498.html
ISO 14064-1:2018 Greenhouse gases, quantification and reporting of greenhouse gas emissions, International Organization for Standardization, https://www.iso.org/standard/66453.html
Product Life Cycle Accounting and Reporting Standard, GHG Protocol, https://ghgprotocol.org/product-standard
Corporate Standard, GHG Protocol, https://ghgprotocol.org/corporate-standard
Accreditation scope LAB-022, Pakistan National Accreditation Council, https://pnac.gov.pk/pdfFiles/LAB-022
Sustainability and environmental compliance services, Tti Labs, https://ttilabs.net/sustainability/
Textiles and apparel testing, Tti Labs, https://ttilabs.net/textiles-apparel
Contact and offices, Tti Labs, https://ttilabs.net/contact
Recommended reading

Inspection
The Pakistan QC Data Barometer: Reading Defect Data Properly

Compliance
What Product Recalls Teach Pakistan Exporters

Inspection
Marketplace Trade Assurance vs Inspection in Pakistan

Inspection
Sialkot Sports Goods QC: What Buyers Specify


ISO/IEC 17025 ACCREDITED
Testing, inspection and certification for Pakistani exports.

General
European buyers push CSRD and VSME questionnaires to Pakistani suppliers. Which module applies, what each pillar asks, and how to answer a data gap honestly.

Textiles & Apparel
ZDHC wastewater testing for Pakistan denim mills and laundries: MRSL conformance levels, effluent parameters, discharge categories and the buyer evidence route.

Textiles & Apparel
Cotton and wet processing both draw on basins already under structural water pressure. Here is what buyers should actually ask about it.