

Inspection
Report
The Pakistan QC Data Barometer: Reading Defect Data Properly
Why defect-rate benchmarking matters to buyers sourcing from Pakistan, what a barometer measures, and how to read one without reacting to normal variation.

A bare defect rate tells a buyer nothing. Most buyers sourcing from Pakistan can name the defects they have seen, but very few can say whether the rate they experienced was normal for the category, better than normal, or a sign that something specific went wrong.
A defect barometer answers that. It records each rate with its product category, inspection stage, sampling basis and defect class, defined the same way every period, so a new figure is read against an established range. Building one is worth more than any single number it produces.
The same product shows a different defect rate at each inspection stage
A buyer who receives a rejection rate of 4 percent has a number without a frame. Four percent of what, measured at which point, on how large a sample, against which defect classification? Those qualifiers are what make a rate comparable. The inspection stage changes the rate even for the same product, because each stage counts a different population of defects.
Stage | What is counted | Why the rate differs |
|---|---|---|
During-production | Defects found while the line is still running and correctable, as in a during-production inspection | Higher observed rate, because the process has not finished and defects are still being generated |
Pre-shipment | Defects remaining in a packed lot, sampled under AQL | Lower observed rate, because correctable defects were already removed |
Post-delivery, at destination | Defects surviving transit and unpacking, plus handling damage | Different again, because transit adds a failure mode that no factory inspection sees |
Pool a during-production rate, a pre-shipment rate and a post-delivery rate into one percentage, and the result can't be compared with anything, including its own history.
Each observation needs five fields, defined the same way every time
Leave out any one of the five and comparability breaks later.
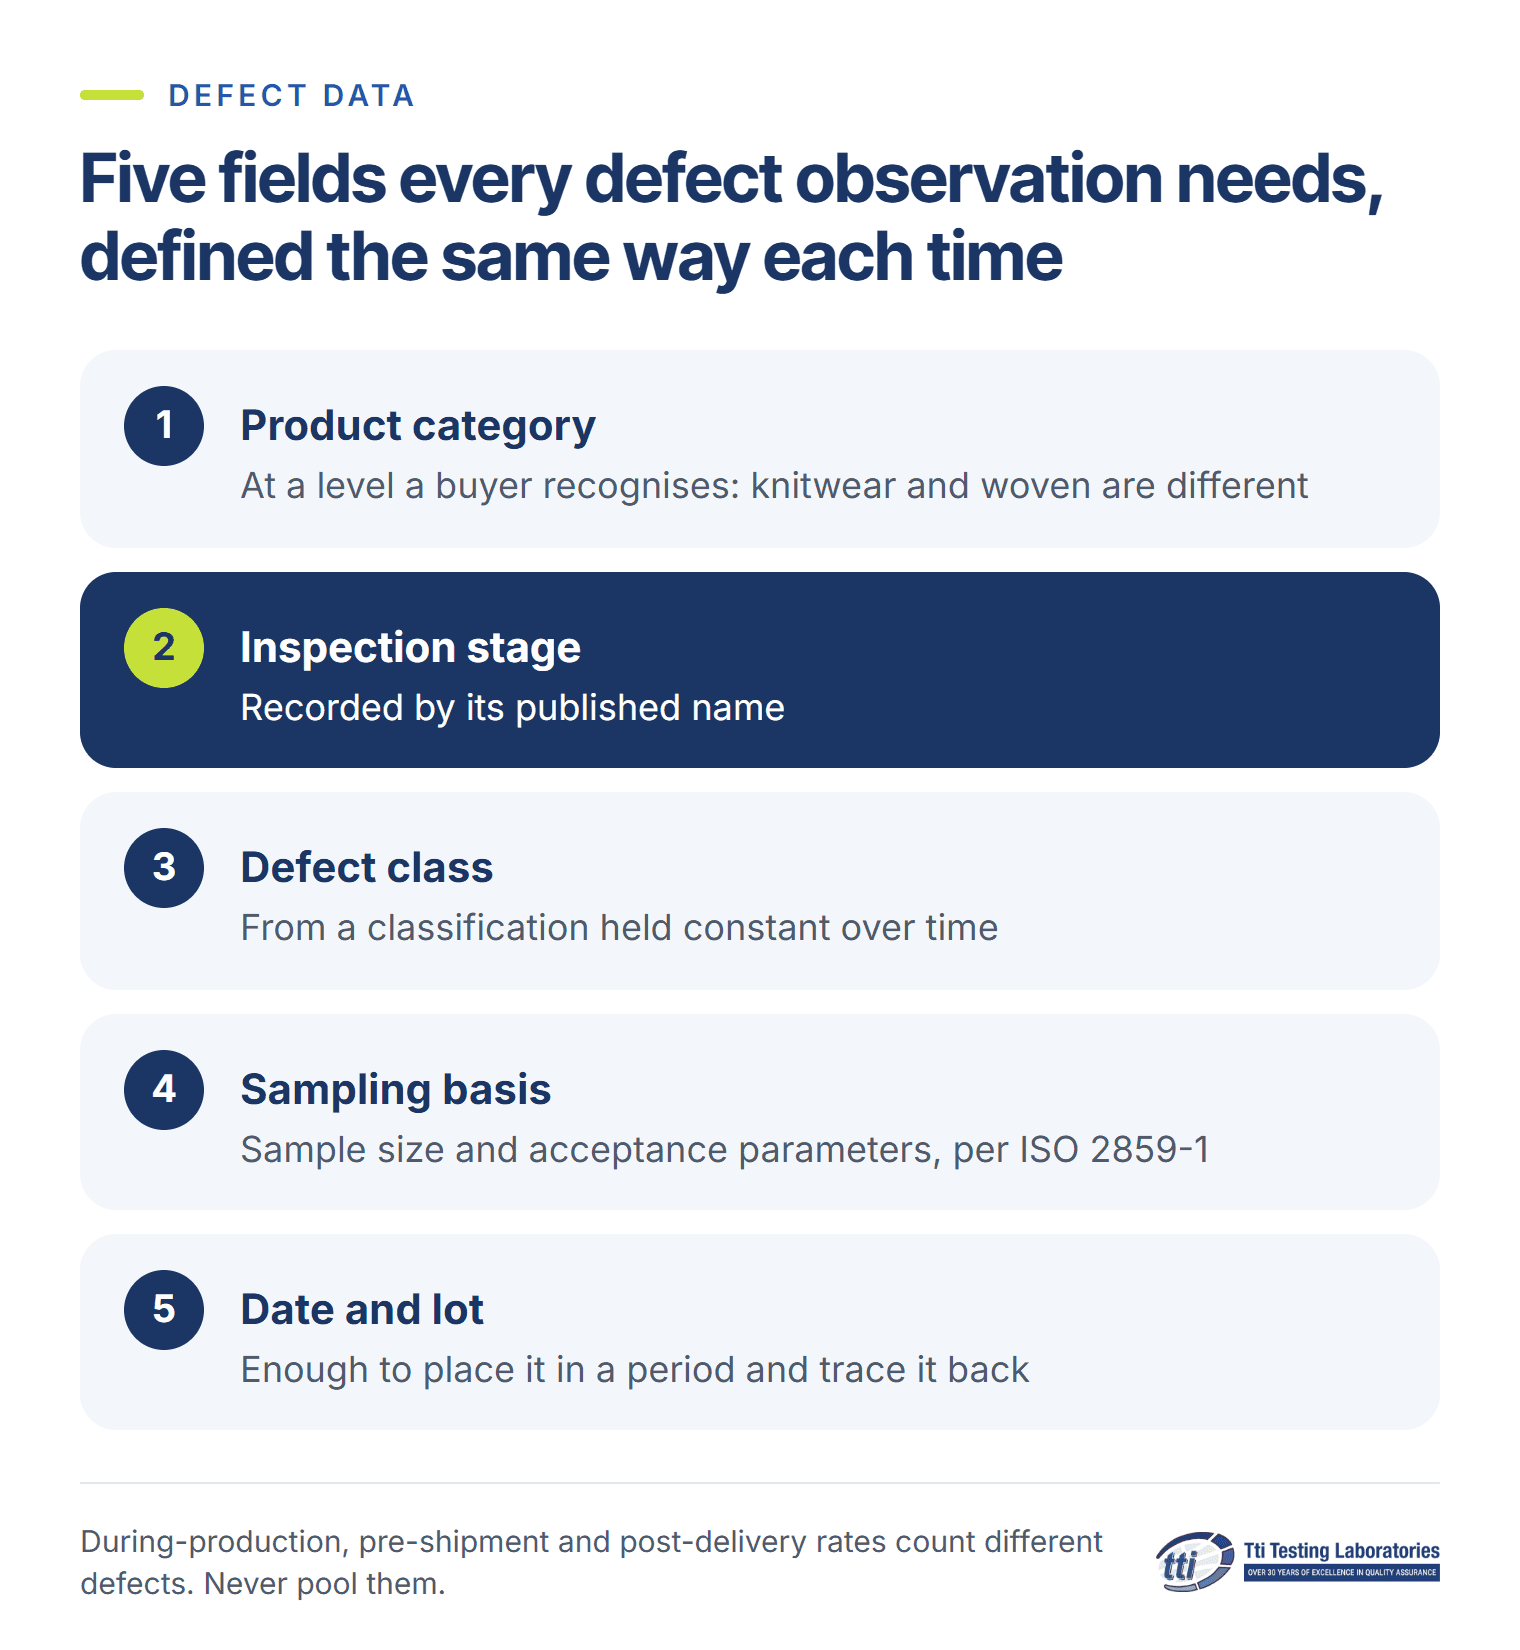
The product category, at a level of detail a buyer would recognise. Knitwear and woven apparel are different populations, and Tti Labs' textiles and apparel programme treats them separately for that reason.
The inspection stage: which of the eight stages produced the observation, recorded by its published name.
The defect class, from the classification used in the defect log, held consistent over time. Changing the taxonomy mid-series severs the series.
The sampling basis: the sample size and the acceptance parameters applied, following the ISO 2859-1 tables, so the rate rests on a known basis.
The date and lot reference, enough to place the observation in a period and trace it back to the record.
Keep the definitions fixed. A barometer is a time series, and a time series whose definition changes at period three is two unrelated series.
Establish the normal range before reading any trend
The most common error is reading a trend before there is a baseline. Two quarters of data don't establish a normal range, and a first quarter with an unusually low rate sets an expectation that the second will appear to break. The sequence that avoids it:
Collect without publishing for several periods, until the category has enough history to describe a range.
Describe the range, not the average. A category whose rate moves between 2 and 6 percent is not a category with a rate of 4 percent, and reporting only the mean hides the variation a buyer experiences.
Publish the range with the number of periods behind it. A range built on four observations is weaker than one built on twenty, and saying so is part of the discipline.
Then compare. A period inside the range is unremarkable. A period outside it is worth a question.
Before reacting to a change, check volume, persistence and mix
Manufacturing data is noisy. A barometer that reacts to every movement will produce more false alarms than insights, and a single quarter rarely means anything.
Start with volume. A rate computed on a small sample swings widely for reasons that have nothing to do with quality, and a category with forty units in a period can't support a conclusion that a category with four thousand can.
Then ask whether the movement lasted. A rate outside the range once is an observation. Outside it twice in succession, it is a trend. That difference decides whether you ask a question or change the programme.
When the headline rate moves, check whether the composition moved first. A programme that took on a harder product, a new supplier or a tighter specification can shift the aggregate rate without anything deteriorating. Breaking the rate down by category and supplier usually finds the cause faster than investigating the aggregate.
The defect mix shows which function to fix
The headline rate measures how much went wrong. The mix of defect classes shows where, and the ranking of those classes is the output that changes what a programme does.
A category dominated by dimensional deviation points at process control, pattern accuracy or measurement discipline. One dominated by shade variation points at dyeing, laundry or the reference standard used for approval. Labelling and packaging defects point at the final stages, where a fix is cheap and immediate. Hardware and trim failures point at component sourcing, not at garment construction.
Those are four different functions. A programme that reads only the headline rate ends up spreading its effort across every stage, and reading the mix puts the effort where the cause is.
A barometer's regular output is a short list of where to look
The useful output is a short list, produced on a regular cycle:
Categories outside their established range, with the period and the volume behind each observation.
The defect classes that moved most, ranked by contribution to change, not by absolute size.
Supplier-level differences within a category, where the volume supports comparison.
Stage-level differences. A defect found during production and not found again at pre-shipment is evidence the correction worked.
Open questions, stated as questions.
The last item keeps the exercise honest. A barometer is a monitoring instrument: it describes movement and tells a programme where to look, but it can't tell the programme why something happened. Finding the cause is the diagnostic work that follows.
What Tti Labs provides for quality benchmarking
Inspection across the published eight-stage softlines cycle, so each observation is recorded at a known stage and never pooled. The accreditation behind it is listed on the Tti Labs accreditations page.
Defect logs classified the same way every time, so a series stays comparable across periods and lots.
AQL sampling at stated acceptance parameters, so a rate can be attributed to a known basis.
Laboratory testing under ISO/IEC 17025 accreditation through PNAC LAB-022, for defect classes that need analytical confirmation beyond a visual judgement.
Findings documented with dated evidence and followed to closure, so each corrective action has a record behind it.
Lahore headquarters, with offices in Karachi, Faisalabad and Sialkot. A multi-city programme can record observations the same way across clusters.
Tti Labs inspects and reports what it finds. It does not set a buyer's acceptance parameters, and it does not characterise a defect rate as acceptable or unacceptable for a buyer's market.
Discuss an inspection and quality monitoring programme with Tti Labs. UAN 111 786 001. ISO/IEC 17020 accredited inspection, PNAC certificate IB-006.
FAQ
What is a QC data barometer?
A regular record of defect rates by product category, inspection stage and defect class, held consistent over time, so each period can be compared against an established range instead of read in isolation.
How much data is needed before a trend means anything?
Enough periods to describe a range, and enough that one unusual period stands out as unusual. A category with one or two observations has no baseline yet.
What should a buyer ask for?
The range instead of the average, the number of periods behind it, the inspection stage at which observations were taken, and the defect classification used.
References
Inspection services, Tti Labs, https://ttilabs.net/inspection
Contact, Tti Labs, https://ttilabs.net/contact
Textiles and apparel inspection, Tti Labs, https://ttilabs.net/textiles-apparel
Accreditations, Tti Labs, https://ttilabs.net/accreditations/
During-production inspection, QIMA, https://www.qima.com/consumer-products/during-production-inspection
Accreditation scope LAB-022 (ISO/IEC 17025:2017, first granted 13 May 2006, valid to 8 August 2027), Pakistan National Accreditation Council, https://pnac.gov.pk/pdfFiles/LAB-022
AQL inspection and sampling explained, QIMA, https://www.qima.com/aql-acceptable-quality-limit
ISO 2859-1, Sampling procedures for inspection by attributes, International Organization for Standardization, https://www.iso.org/standard/2859-1
Recommended reading

Compliance
What Product Recalls Teach Pakistan Exporters

Inspection
Marketplace Trade Assurance vs Inspection in Pakistan

Inspection
Sialkot Sports Goods QC: What Buyers Specify

Compliance
Audit Duplication: How Small Exporters Stop Paying Twice for the Same Audit


ISO/IEC 17025 ACCREDITED
Testing, inspection and certification for Pakistani exports.
General
Marketplace badges verify a seller, not a shipment. See what trade assurance covers, what only a pre-shipment inspection proves, and what to ask first.
General
Sialkot sports goods QC for buyers: football sphericity and weight tolerances, glove EN 388 tests, inflatable leak checks, and how AQL sampling applies.

General
How production monitoring in Pakistan catches schedule slippage before a shipment misses its vessel, and the reporting discipline that makes it all work.